Here are the results of the independent Western States Endurance Run (WSER) Runner Survey from the June 23-24, 2018 race, conducted by ultralive.net.
WSER runner registration takes place in Squaw Valley Friday before race day and 2018 allowed for another year of the ultralive survey team to be in position. Runners are happy to participate while they wait in line for check-in providing us a 95% participation rate of the 369 starters.
Here are the surveys from 2014, 2015, 2016, and 2017.
Survey Questions
The runners were asked the following questions. Data was recorded by bib number allowing us to correlate the responses to finish times to make the analysis even more interesting. All data however is compiled and reported anonymously:
- Number of 100’s completed
- Number of years running ultras
- Will they use a crew?
- Will they use a pacer?
- Did they attend the Memorial weekend training camp
- Shoe brand
- Sock brand
- Pack type/brand
- Lighting brand
- Did they pay for coaching services?
- A few questions about lodging for the race to share with host sites
This year’s race was the 9th hottest on record but that fact did not seem to impact the runners. Of the 369 starters we saw 299 finishers (81%) under 30 hours of which 123 (33.3%) finished under the coveted 24 hour mark for a Silver Buckle.
A total of 284 of the 299 finshers (95%) are in the survey.
Note: All graphs show numbers related to runners who participated in the survey and finished the race. DNS and DNF are not included in the final graphs.
Finish Hour
For sub 24 hour finishers completing the survey, 43 out of 123 (35%) finished in the 23rd hour of the race to get a silver buckle (compared to 36.2% in 2017 with only 69 Silver Buckles). In the last two hours of the race, there were 101 (40%) finishers. The busiest times on the track are typically between 4-5 AM and 9-11 AM on Sunday morning and 2018 proved no different. The graphs show the distribution of finishers by hour (14 hours to 29 hours).


Despite the heat in this year’s race, the finish rate of 81% is much higher than last year’s 67.2%.
An interesting data point for this year is that only “experienced” runners had a DNF – at least one 100 completed and over a year of ultrarunning.
Shoes
This is the fifth year Hoka was the most popular shoe (34.9%) for all finishers with Altra staying in second place with 23.2%. Salomon (10.9%) again was ahead of Brooks (6.0%) which was the second most popular shoe just three years ago (2015). The rankings remained the same for the top 3 most popular shoes with the sub-24 hour finishers as well. We acknowledge some runners did plan to change shoes during the race and may have changed to a different brand so we asked that they provide the brand they planned to start the race wearing.


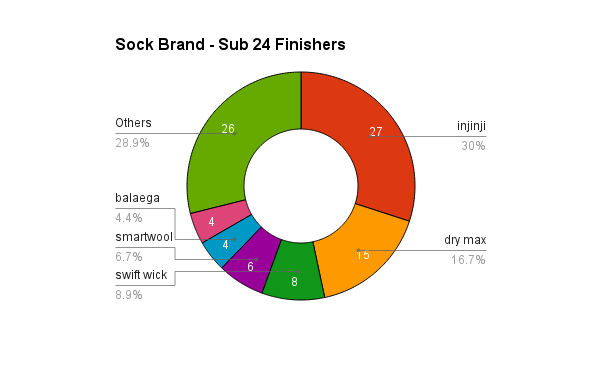
Socks
Injinji was just barely the favorite over Drymax for the most popular sock choice for finishers. And it was Drymax ahead by sixteen over Injinji for the sub-24 hour finishers. The “other” category was quite large this year and runners seem to like a large variety of socks.


Paid Coaching Services
A little over a quarter of the runners use a paid coaching service for both the overall and sub-24 hour finishers. And from the data it seems that using a coach does not decrease the chance of a DNF compared to the finishers.

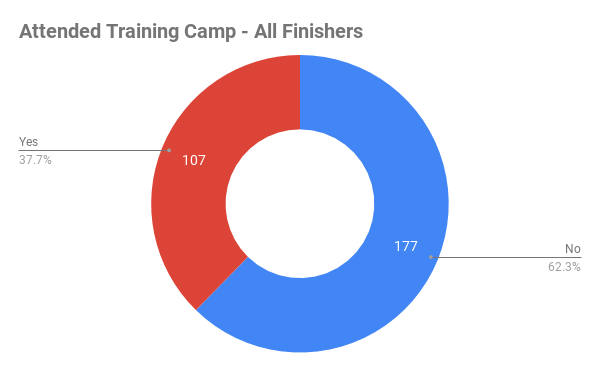
Memorial Weekend Training Camp
The training camp held on Memorial Weekend is a great weekend to get on the course for those running, supporting or spectating the race. Only a third of the runners in the survey attended the camp. However, attending camp does not seem to decrease the chance of a DNF as 38% of the runners who did not complete the race were at the training camp.

Lighting
Petzl’s remains the favorite light brand for all runners regardless of finish time (sub or over-24 hour) with Black Diamond second again. Only one runner was able to complete the course without a light – Jim Walmsley (and he did have a Petzl just in case!)


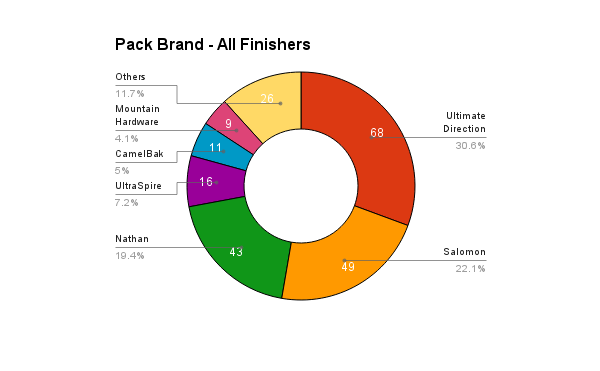
Packs
Salomon was the top choice for all runners (sub 24 and overall) with Ultimate Direction and Nathan in second and third. Not everyone chooses and pack and 38 responded to the survey saying they would only use handheld bottles for the race.


Crew and Pacer
The use of a crew and/or pacer are personal preference during a 100-mile race but may be more popular at WS – what are your thoughts? The following chart shows the correlation of using a pacer or crew to finish hour.


Special recognition should go to the 18 runners in the survey with no crew and no pacer. Five of them managed to finish in less than 24 hours to earn a well deserved silver buckle.
Data Accuracy
369 runners started the 2018 Western States 100 Mile Endurance Run
Ultralive.net team surveyed a majority of those runners through the registration process at Squaw Final survey reflects N = 353 (95.6%) athletes though individual questions may vary if athlete did not answer or know answer. And also note that this analysis was done by amateur statisticians and inspired by the Ironman “bike survey” in Kona.
Credits
The team would like to thank all of the runners who took time to talk with us and answer these questions. Many thanks to the ultralive.net survey team: Kara Teklinski, Emily Yu and Jessi Goldstein.
Any feedback or insights are welcome!